Data-Driven Scenario Geometry for Equity & Option Portfolios
Executive Summary
This project explores how a protective put option reshapes the geometry of plausible future outcomes for NVIDIA (NVDA). Rather than forecasting returns or assigning fragile probabilities, the analysis focuses on scenario deformation, tail behavior, and convexity effects.
The result is a qualitative yet rigorous view of how hedging decisions influence the structure of uncertainty.
2. Objective
Traditional financial models often rely on assumptions (normality, stationarity, single-regime behavior) that fail to capture real-world market dynamics. The objective of this study was to build a data-driven Monte Carlo engine capable of:
- capturing empirical return characteristics
- generating realistic price paths
- repricing options dynamically
- comparing the scenario envelopes of Equity-only vs Equity + Put portfolios
The goal is not prediction, but understanding how hedging alters the shape of possible futures.
3. Methodology
3.1 Empirical Return Modeling
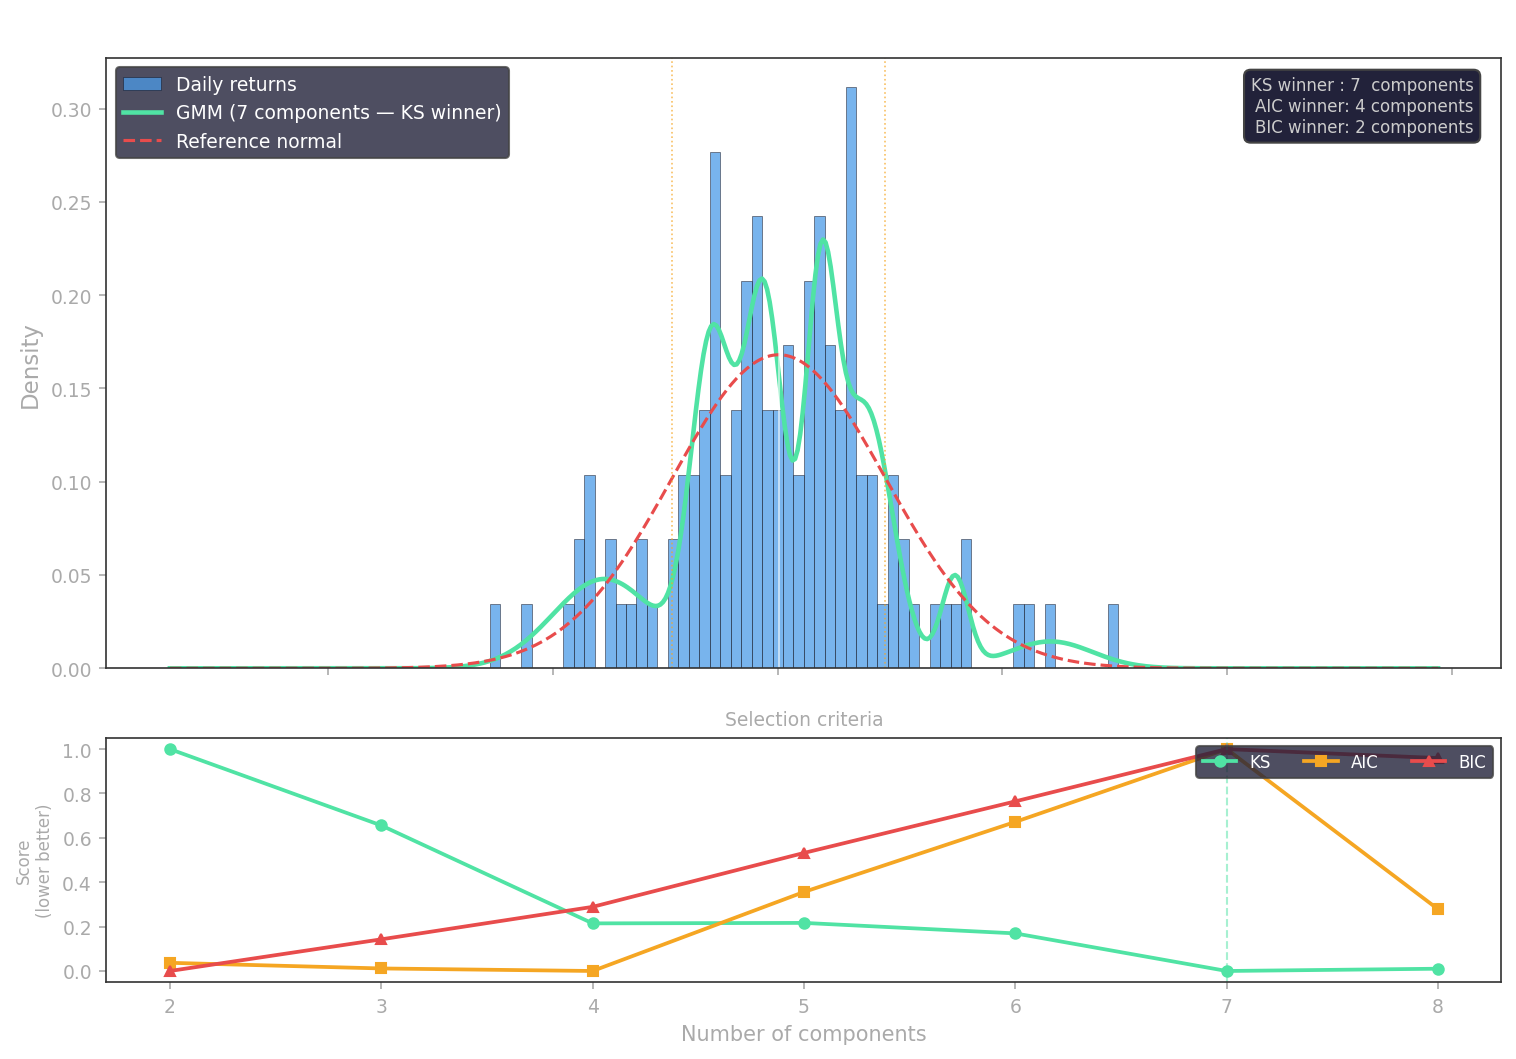
Daily NVDA returns from the past six months were analyzed and fitted using a Gaussian Mixture Model (GMM) via Expectation–Maximization.
This approach captures:
- fat tails
- asymmetry
- multi-regime behavior
It provides a flexible, data-driven distribution for scenario generation.
3.2 Monte Carlo Scenario Generation
Using the fitted mixture distribution, 50 price paths were simulated over a 58-day horizon through a random-walk process with rejection sampling.
This avoids imposing a theoretical model (e.g., GBM) and preserves the empirical structure of returns.
3.3 Dynamic Option Repricing
A long put option (Strike 176, Expiry Aug 2026) was incorporated into the portfolio.
Steps:
- Implied volatility was inferred from the market price using Black–Scholes.
- The option was repriced daily along each simulated path using the same IV.
- Portfolio value = Equity + Put was computed for each path and each day.
This allows convexity to emerge naturally in the simulation.
4. Results
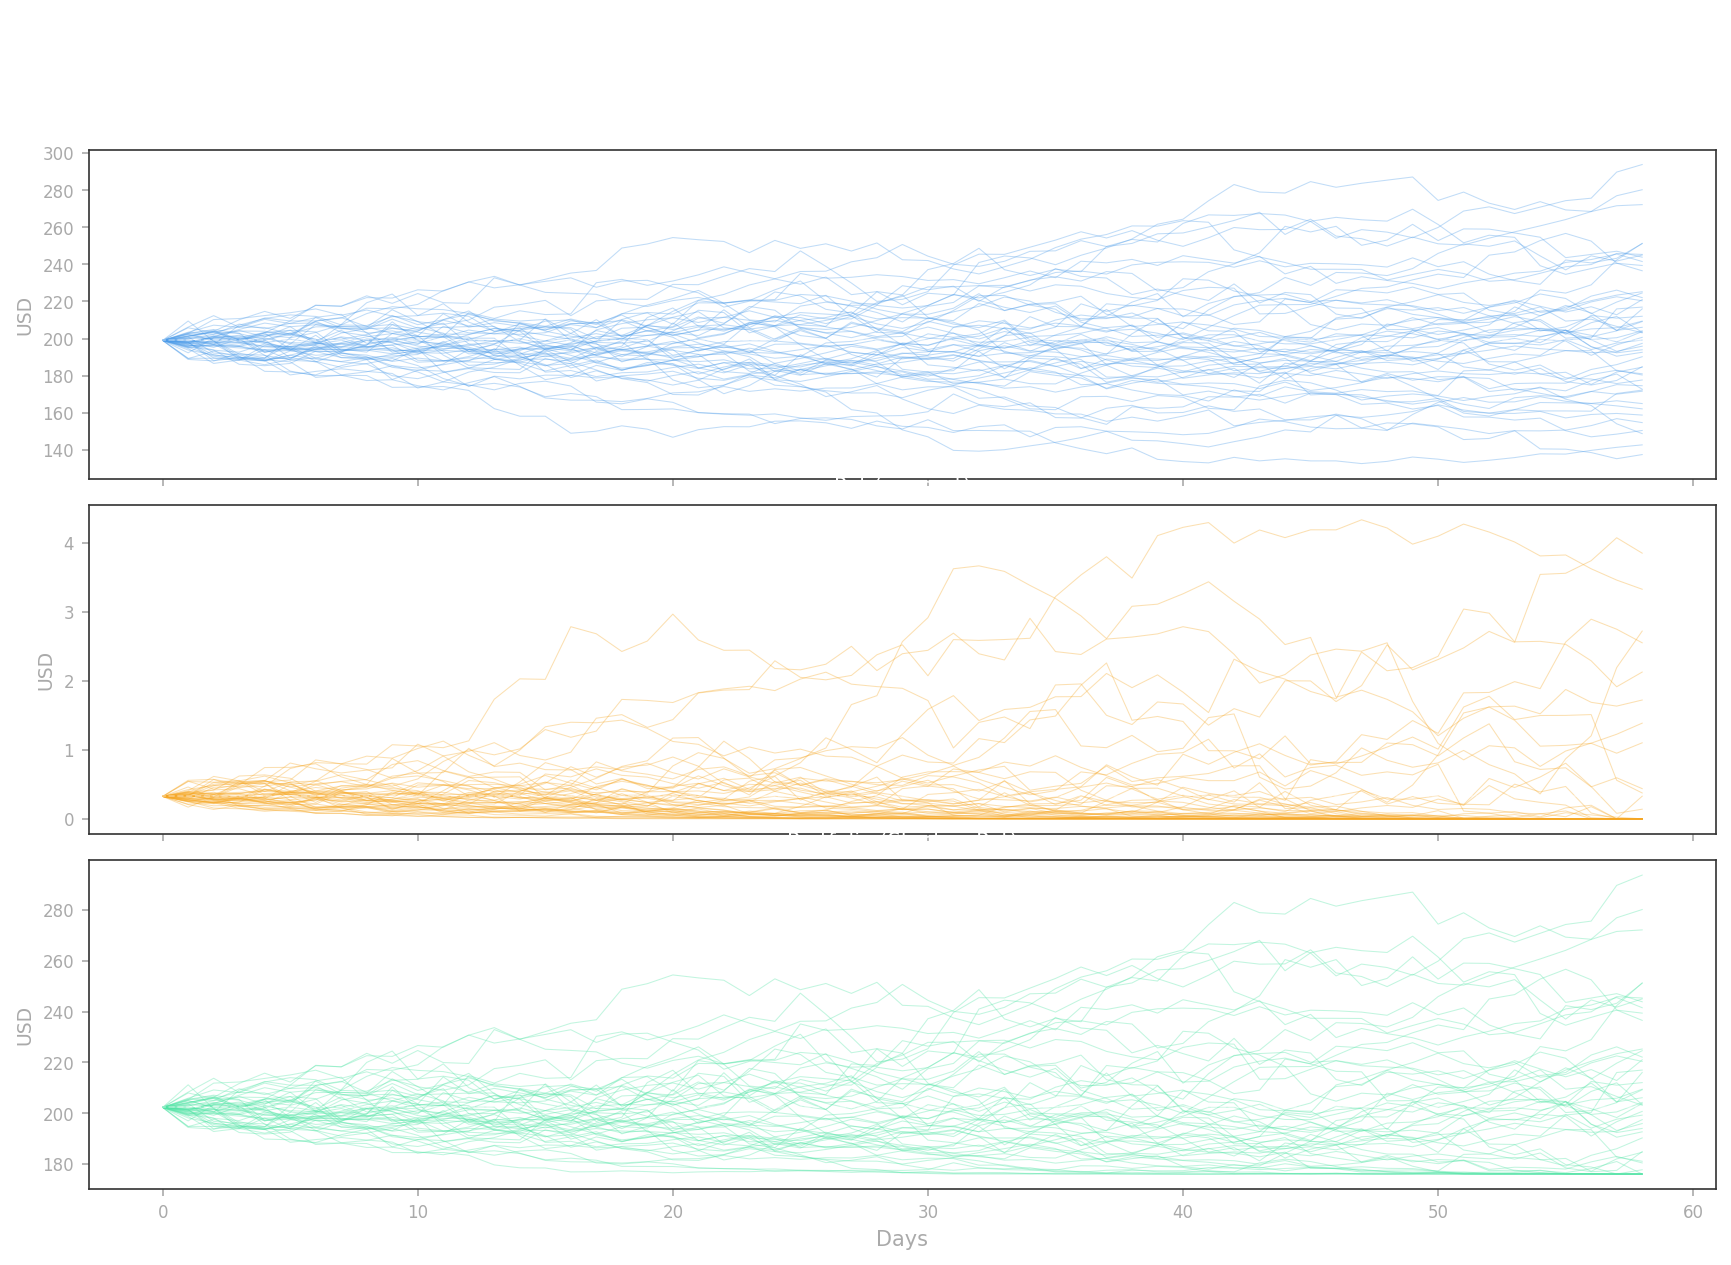
4.1 Scenario Envelopes
Three envelopes were generated:
- Equity-only: Wide dispersion, symmetric volatility, deep negative tails.
- Put value: Convex response — negligible in calm markets, significant in stressed scenarios.
- Equity + Put portfolio: Noticeably narrower envelope with compressed left tail and preserved upside.
The protective put does not eliminate uncertainty; it reshapes the distribution, especially in adverse paths.
4.2 Qualitative Risk Interpretation
Instead of assigning precise probabilities, the analysis focuses on scenario geometry:
- Downside scenarios become less severe.
- Extreme losses become less plausible.
- The portfolio gains asymmetric protection: limited cost in benign markets, meaningful lift in stressed markets.
This aligns with a more realistic view of financial uncertainty, where the objective is robustness, not prediction.
5. Key Insights
- Convexity matters: The put introduces curvature that lifts the worst paths without suppressing upside.
- Tail reshaping is visible: The left tail of the portfolio envelope is significantly compressed.
- Empirical modeling > theoretical assumptions: Mixture models capture real-world behavior that single-regime models miss.
- Scenario geometry > probability claims: The focus is on plausibility, not on fragile numerical probabilities.
6. Conclusion
This case study demonstrates how a data-driven Monte Carlo framework can be used to explore the shape of uncertainty in equity portfolios.
By combining empirical return modeling, dynamic option repricing, and scenario visualization, it becomes possible to understand how hedging decisions influence the structure of future outcomes.
Options do not remove risk — they reshape it. And understanding that shape is often more valuable than forecasting a single outcome.